Use the Dashboard
The Skulk dashboard is served by each node with dashboard assets installed.
Open it from the desktop app or visit http://localhost:52415 on that machine.
A dashboard connected to one node can show the cluster; you do not need to find
the elected master first.
The screenshots below show the actual dashboard and live cluster state at capture time. Available models and resource readings change as the cluster runs.
Cluster: see where work is running
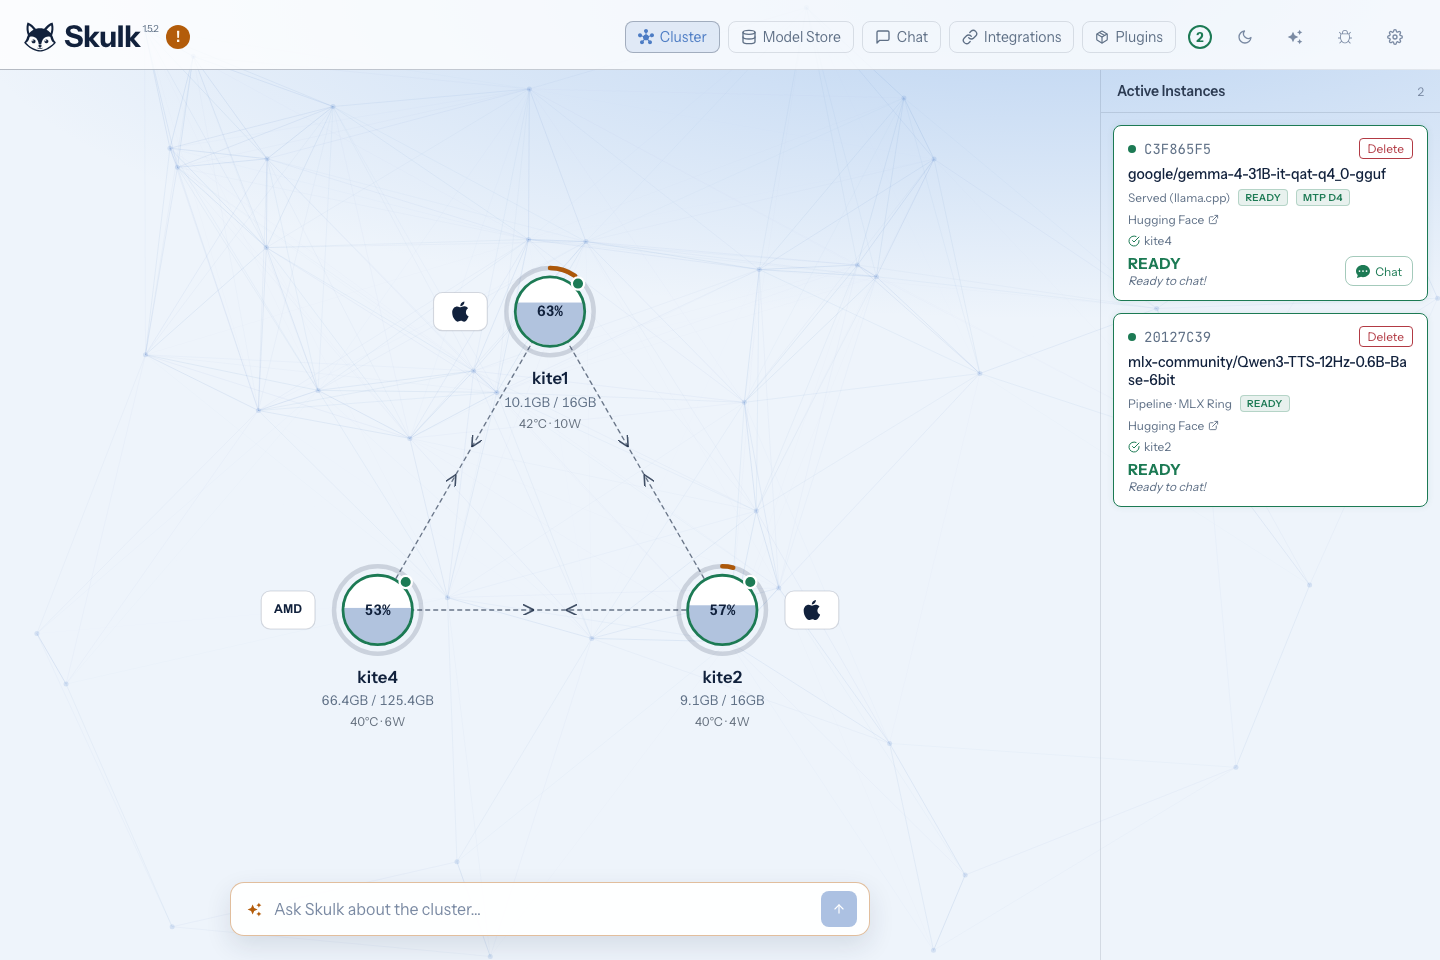
The topology shows the connected machines and their reported resource use. Select a node to inspect its observations. The Active Instances panel separates ready, loading, and failed model placements and identifies their participating nodes. The panel toggle in the header opens or closes it.
A node being connected does not mean its model is ready. Wait for a ready instance before chatting or sending an API request. If a runner fails, inspect the reported reason and the node's diagnostics before retrying; the operator runbook explains common failures.
When enabled, the Ask Skulk control opens the resident Steward conversation. You can ask it to investigate the cluster and review any proposed operation before approving it. See Talk to Skulk.
Model Store: separate downloads from placements
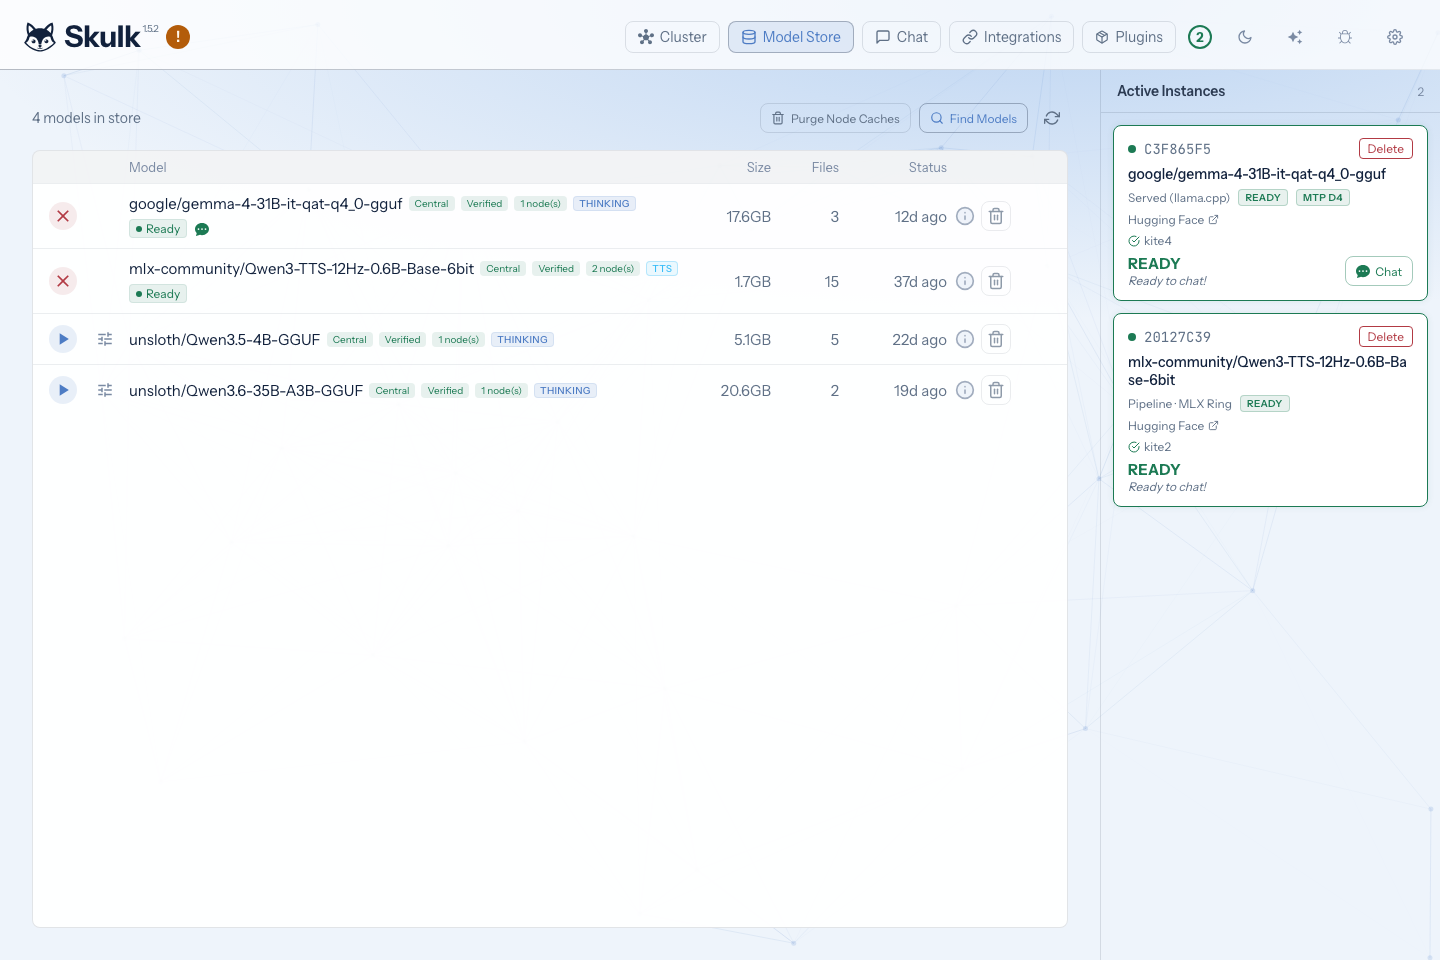
Open Model Store to inspect canonical downloads, then Find Models to browse and filter models. Search results describe catalog entries; store inventory describes downloaded artifacts; Active Instances describes running placements. These are different views of the model lifecycle.
Choose Launch for a model to review placement options. Skulk considers the model's exact artifacts and capabilities, installed engines, current memory, and topology. Review the proposed nodes and launch settings. An accepted launch still has to finish staging and loading before it is ready.
Stopping an instance frees its runtime resources. Deleting a canonical download removes stored files. Clearing staging removes eligible node-local copies. Use the action that matches your intent; the model store guide explains retention and recovery.
Chat: choose a ready model
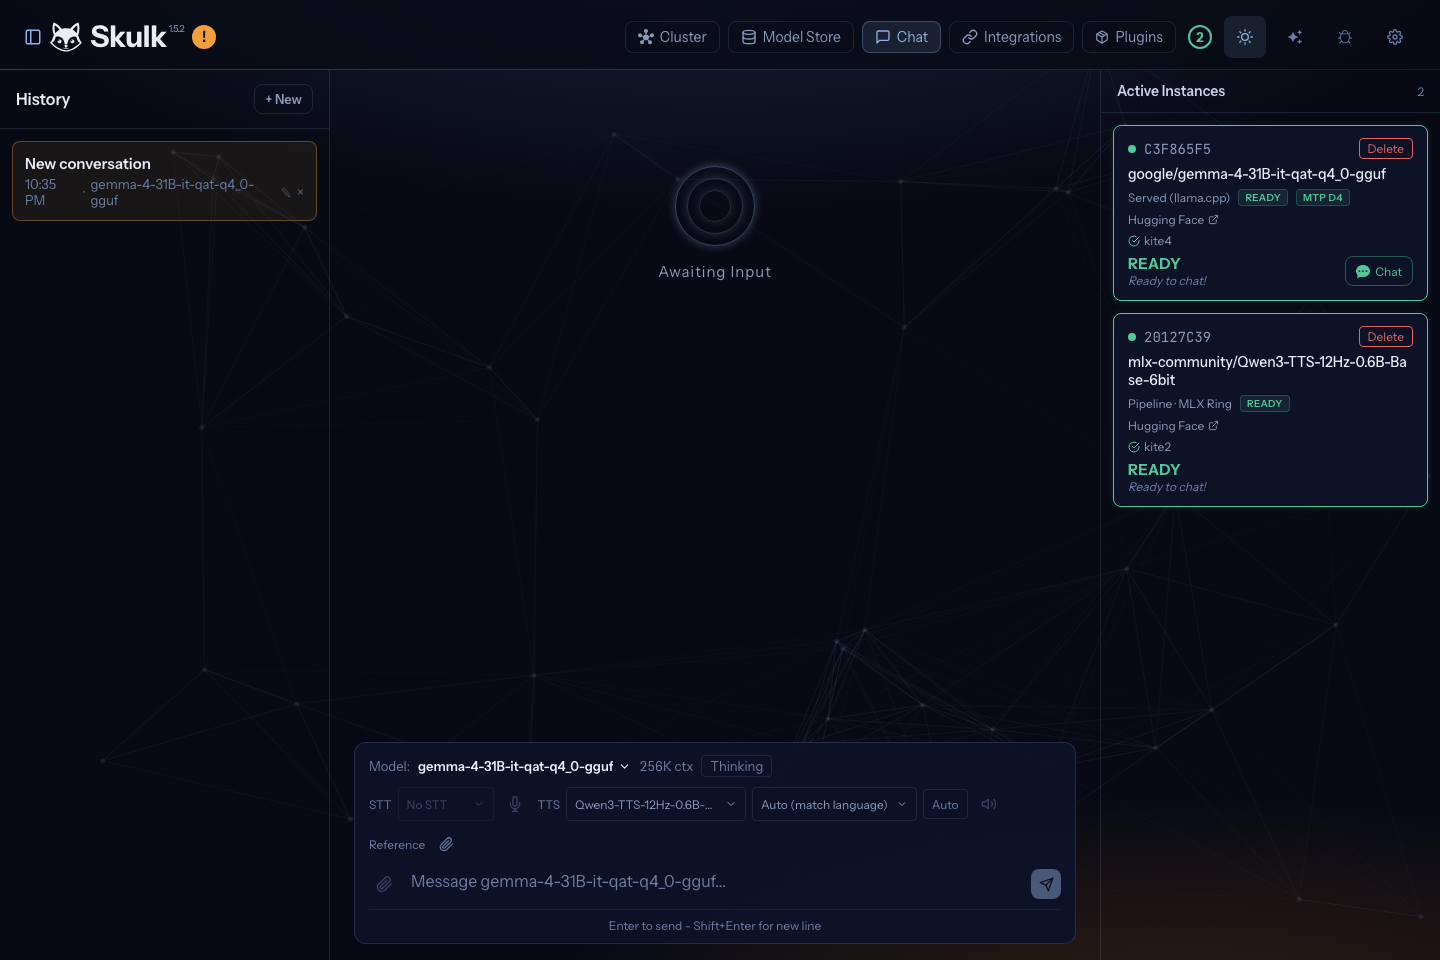
Choose a ready chat model in the composer. Conversations, model selection, attachments, and generation controls live in the Chat view; history and active instances can be shown alongside it on wider displays. Model-specific controls appear only where the selected model supports them.
Image input requires a vision-capable placement. Microphone transcription and spoken responses require the corresponding ready speech models; realtime capture additionally needs realtime capability. Browser microphone access is subject to the browser's permission and secure-context rules. See inference and speech before assuming that an installed model provides every modality.
Selecting Skulk as the chat target uses the fabric's Steward rather than a normal application model. Its authority and proposal rules are described in the Steward guide.
Integrations: connect another tool
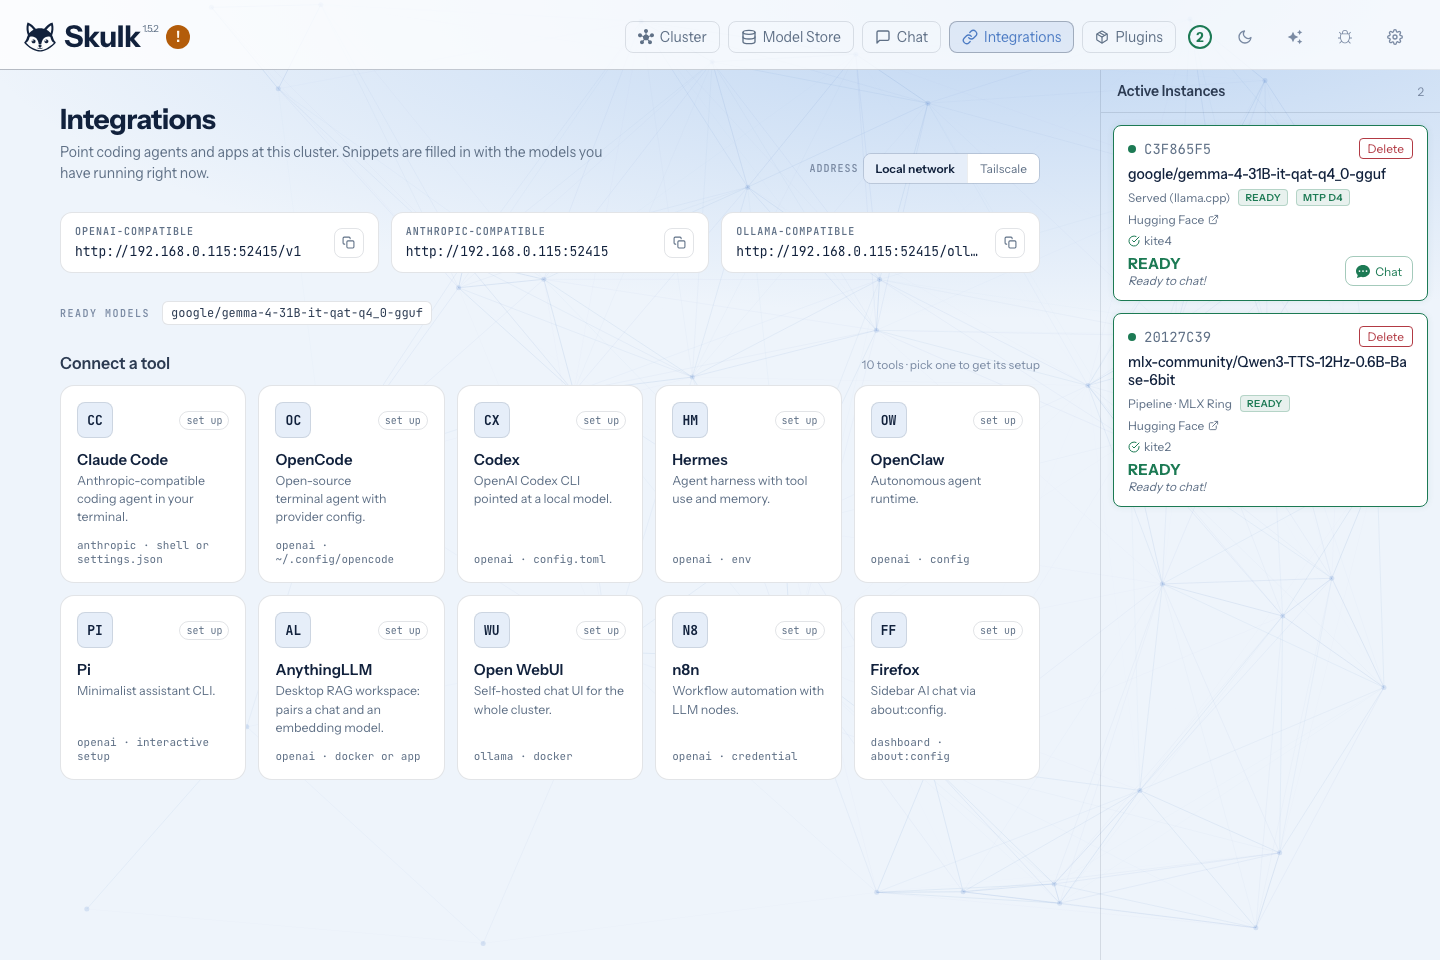
Integrations generates configurations for coding agents, chat clients, and workflow tools using the node address and ready model inventory. Select a tool, choose its model where offered, and copy its configuration. The integration guide explains API formats and address selection.
Plugins: inspect installed capabilities
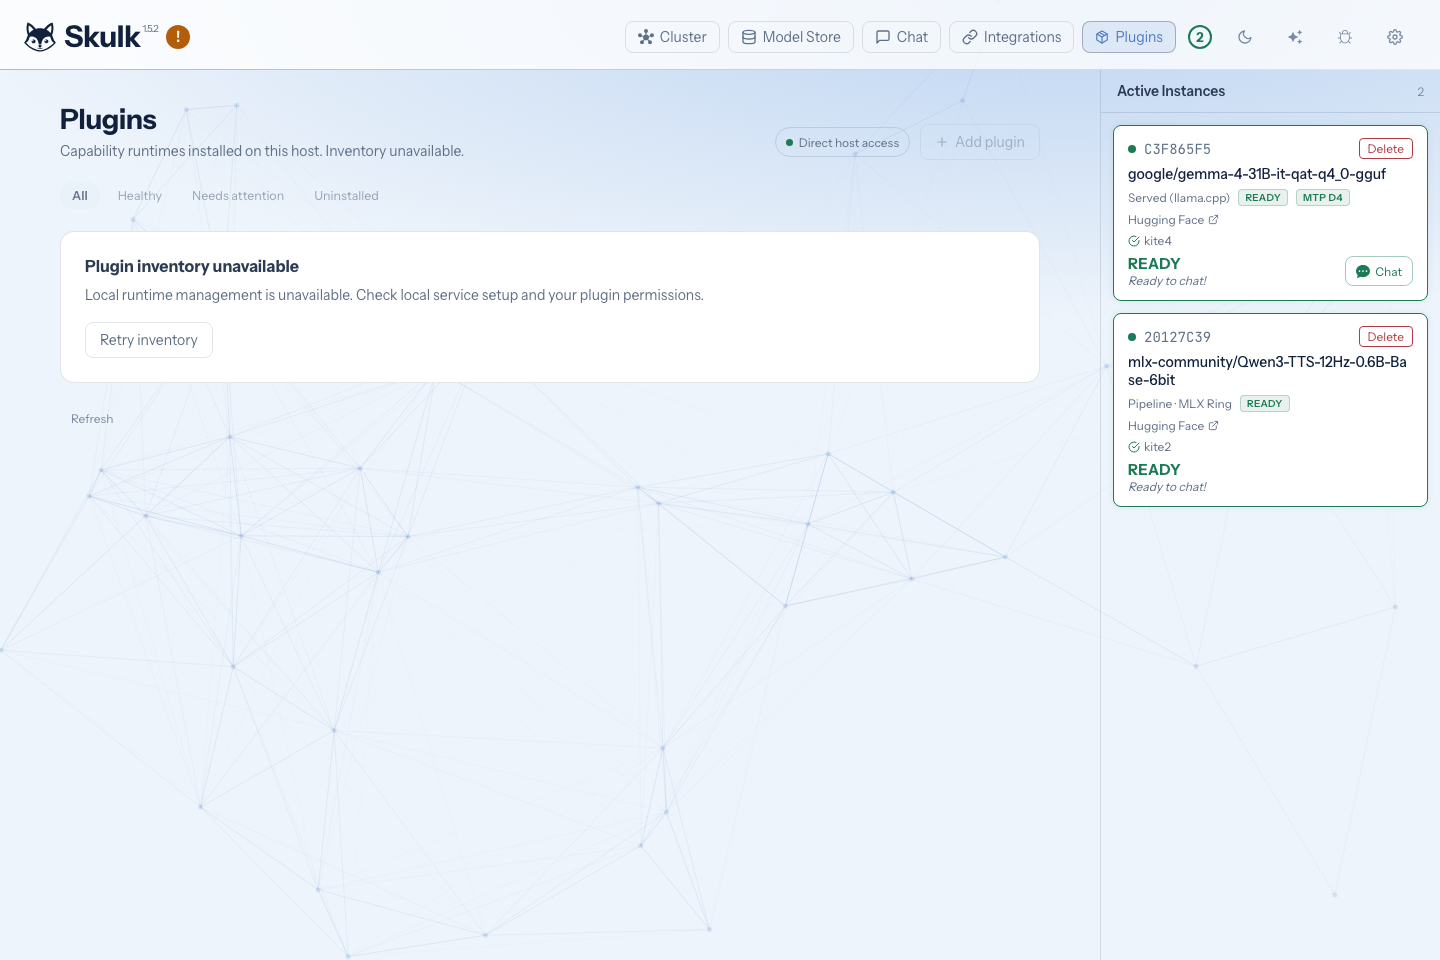
Plugins shows installed managed runtimes, availability, and lifecycle controls. Inspect a runtime's status or configuration before using its capability. A stopped or unavailable plugin is different from an empty plugin inventory, and installing a plugin does not grant authority for external operations. See capability nodes for installation, configuration, proposals, and cleanup.
Settings and pairing
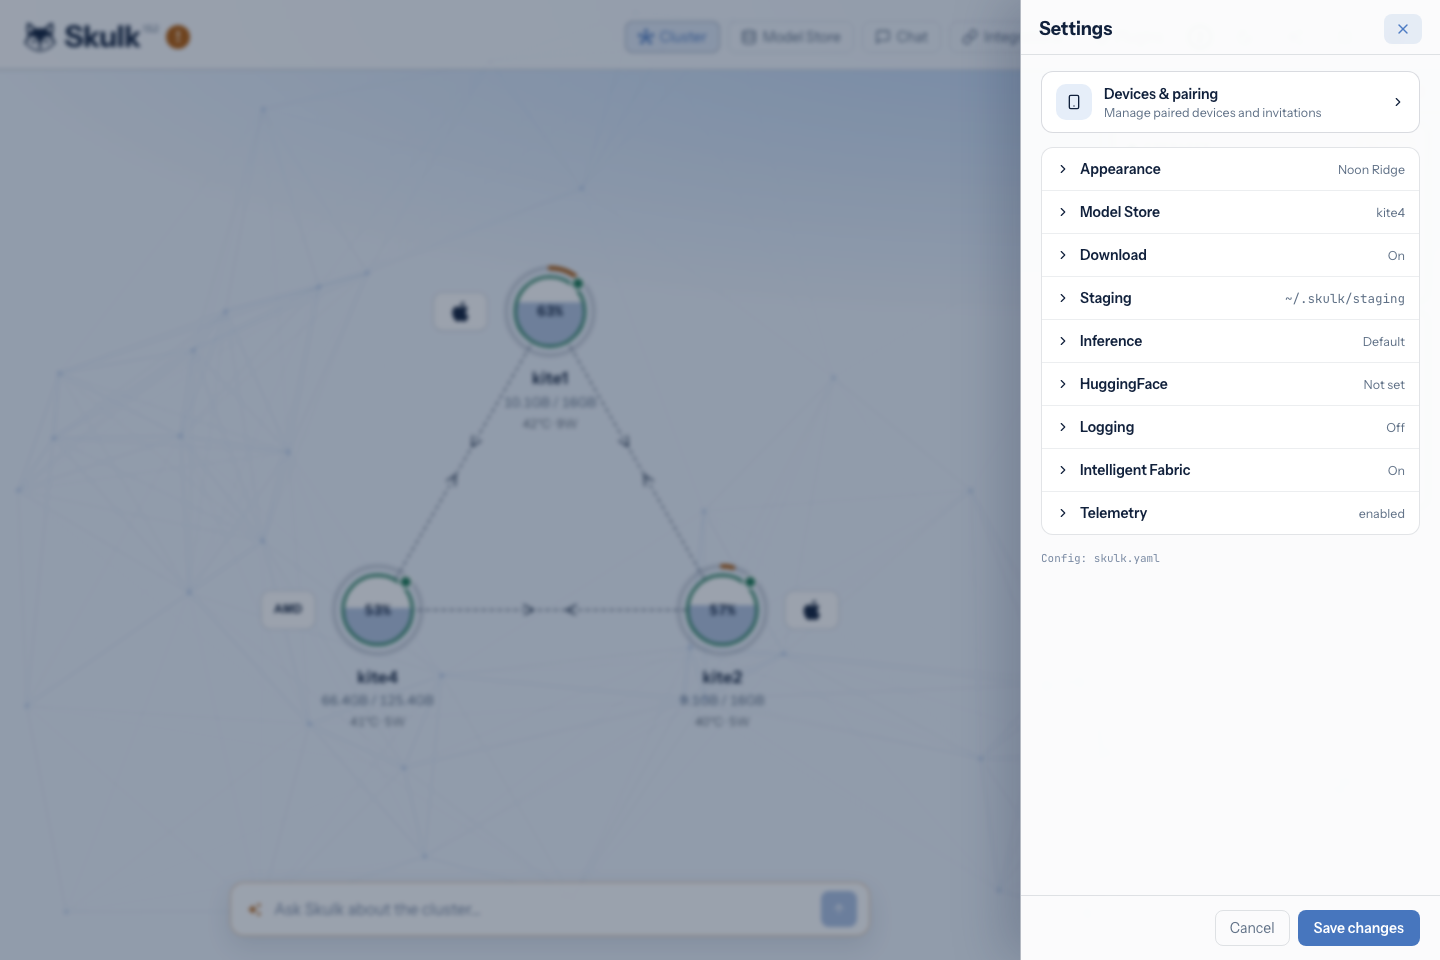
For a packaged Skulk installation, use Settings in the dashboard to configure the cluster. You do not need a terminal or a hand-edited configuration file for the controls exposed here. Expand a section, change its values, and choose Save changes.
| Section | What you configure |
|---|---|
| Appearance | Dashboard color theme |
| Model Store | Store enablement, host, HTTP listener, port, and canonical path |
| Download | Hugging Face fallback |
| Staging | Node-local cache, path, and cleanup on deactivate |
| Inference | KV cache backend for subsequent model launches |
| HuggingFace | Access token for models requiring authorization |
| Logging | Structured logging and ingestion URL |
| Intelligent Fabric | Fabric capability enablement |
| Telemetry | Usage and diagnostic sharing choices |
The Settings guide explains each control, when changes take effect, and which configuration is shared with other nodes. Advanced file and command-line configuration is available for headless deployments and development.
Open Settings → Devices & pairing to connect the native operator app. Choose the invitation lifetime and device limit, then Generate pairing code.
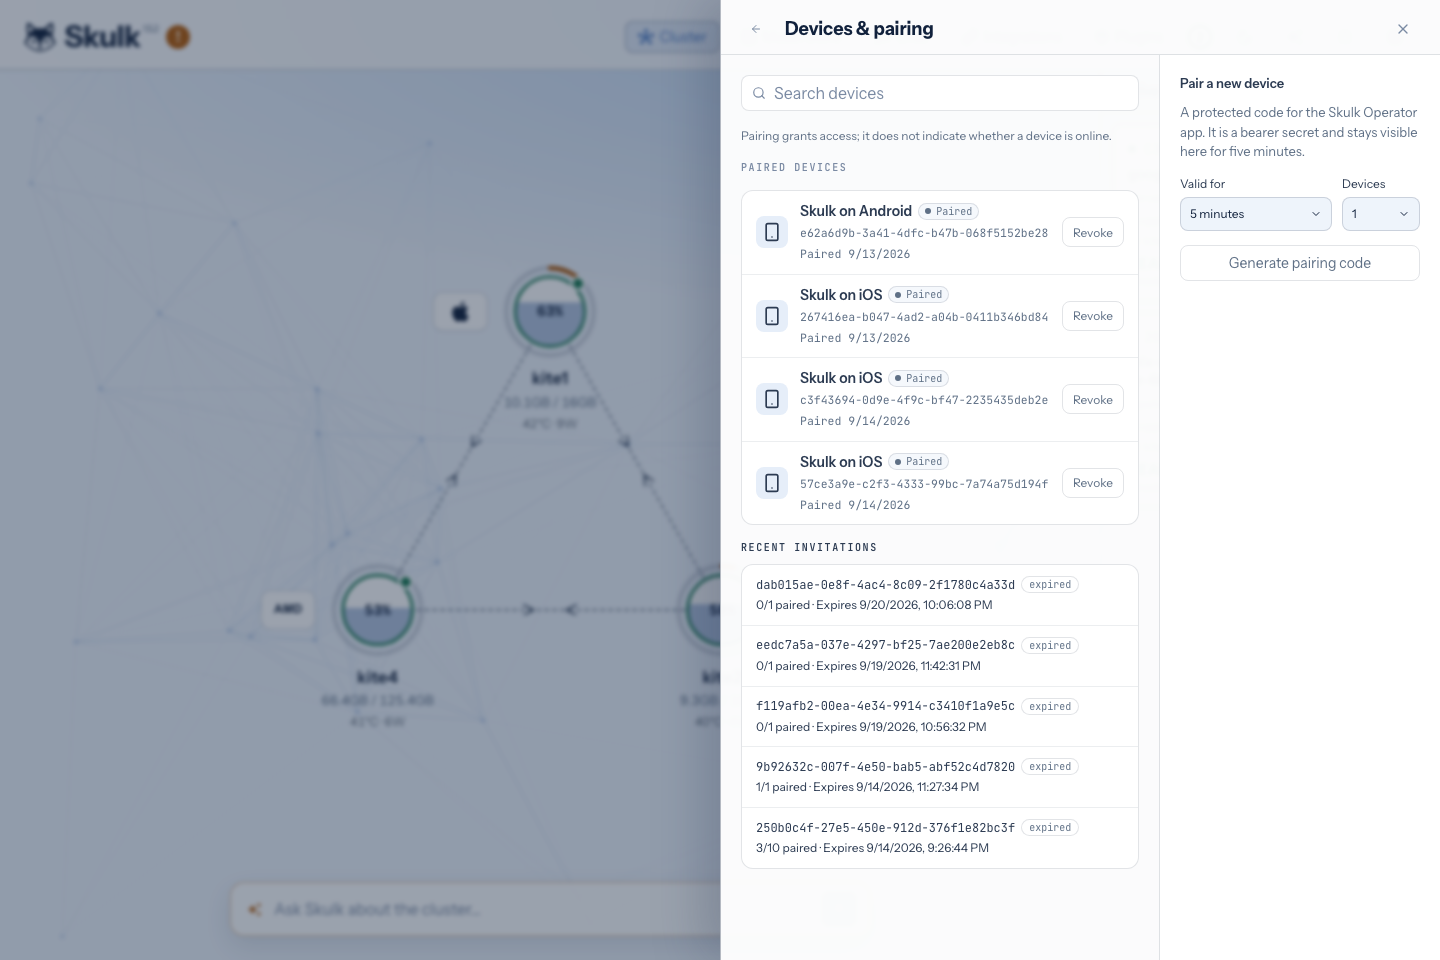
Scan the resulting QR code in the mobile app. This pairs an operator device; it does not add a compute node. Invitations and device revocations take effect immediately, independently of the Settings Save changes button. Follow remote access for the full generation-and-scan workflow.
Observability and phone layouts
Observability provides live runner observations, node details, and saved traces. Tracing is an explicit debugging control, while the live status panels remain useful without recording a trace. See tracing and diagnostics.
On a phone, the header navigation becomes a menu and side panels become drawers. The mobile dashboard guide explains that browser layout. The native app is a separate remote operator interface with its own pairing, device storage, and activity history.